Testing and debugging
Debugging a workflow is not reading the canvas until it looks right. It is running a bounded execution, reading the step log, and changing one thing at a time. This page walks through that procedure with the real controls.
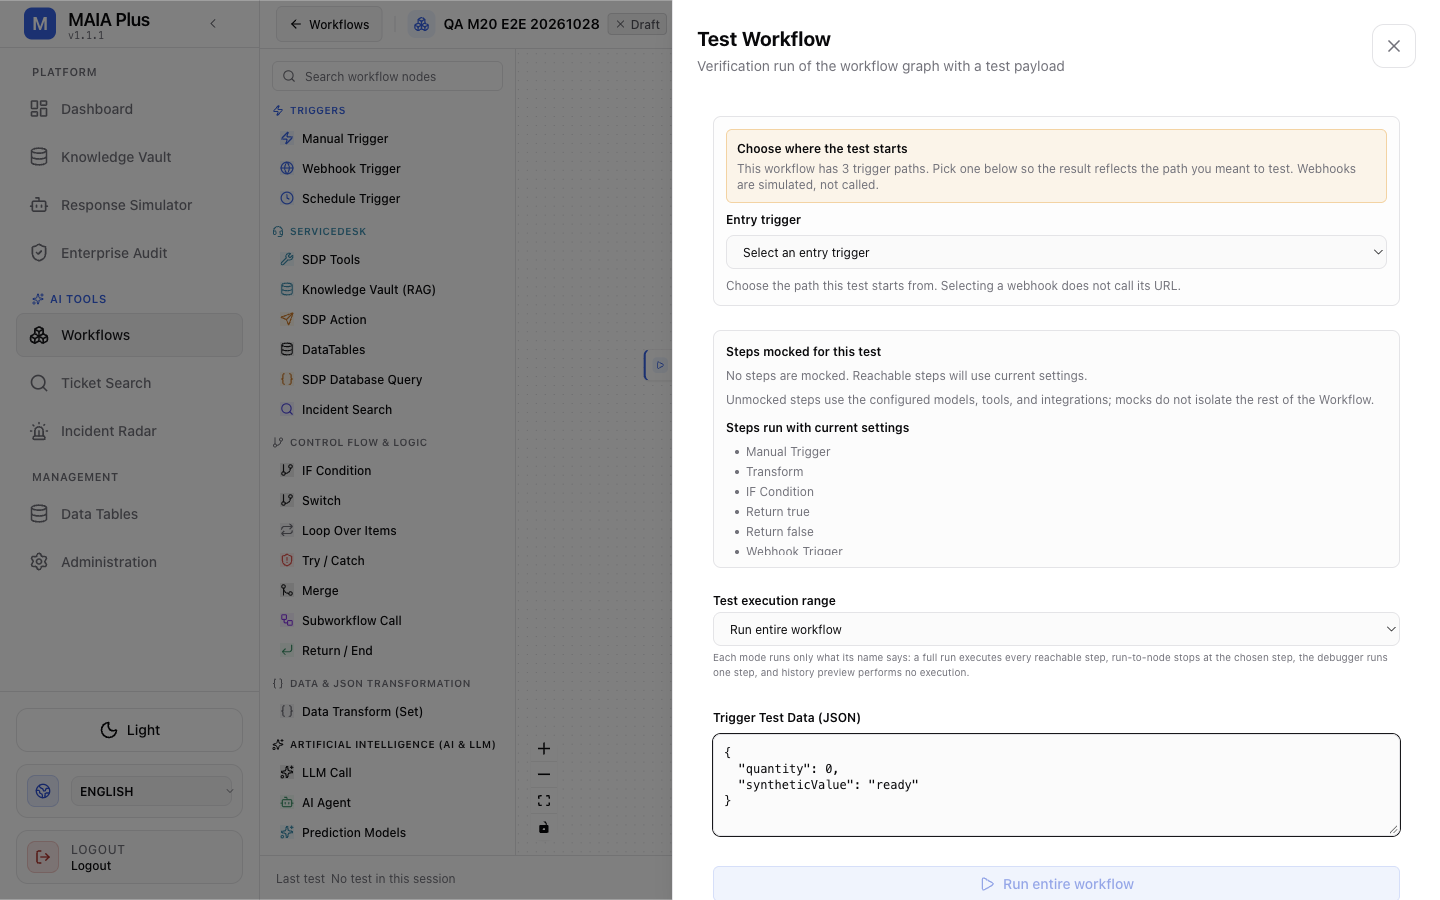
The test drawer answers three questions before anything runs: where it starts, which steps are mocked, and how far it goes.
Before you run
Section titled “Before you run”Three decisions determine whether a test is safe and useful:
- Entry trigger — which path the test starts from. Selecting a webhook does not call its URL; it simulates the payload.
- Mocked steps — steps left unmocked use the real models, tools and integrations. A mocked step is isolated; the rest of the workflow is not.
- Execution range —
Run entire workflow, run to a chosen step, the step debugger, or history preview (which performs no execution).
Start narrow: run to the step you suspect, not the whole graph.
Step by step
Section titled “Step by step”1. Read the graph for the three usual faults. A provider node on the main flow, a branch output with no edge, an expression referencing a node that a path skips. Fix those before running anything.
2. Open the test drawer and choose the entry trigger. If the workflow has one path, there is nothing to choose; with multi-entry routing, the entry decides the payload shape.
3. Supply test data. The Trigger Test Data (JSON) field is the payload the first node receives. Write the smallest realistic payload — a real ticket id is better than a fabricated one, a synthetic one is better than a production write.
4. Set the range to the failing step. “Run to this node” executes everything up to and including that step, then stops. Nothing after it runs, so no write occurs beyond it.
5. Run and read the step log. For each executed step you get its status, duration, input and output. The first step with a failed status is the fault; the step before it is usually the context.
6. Inspect the output that the next step will read. Compare it against the expression the next step uses. An expression that reads $.category from an output that nests it under $.data.category fails here, not in the model.
7. Change one thing and re-run the same range. Two changes at once make the result uninterpretable.
8. Widen the range — one step at a time — until the workflow completes or the next fault appears.
Isolate instead of guessing
Section titled “Isolate instead of guessing”- Run to this node (node toolbar) — cheapest isolation; runs only the path into that node.
- Add Breakpoint — pauses the run at that node so you can inspect state before the next step mutates it.
- Mock a step — replaces one step’s result; use it to test downstream logic without calling a model or writing to ServiceDesk Plus.
- History preview — shows what a previous run did without executing anything. This is the right tool when you only need to re-read a failure.
What a run leaves behind
Section titled “What a run leaves behind”Every execution writes an audit record: the run id, the steps, the tool calls, the business result, and any approval. A test is not invisible, and a test that reached a write tool did write. Check Enterprise Audit after a surprising test.
Reading a failure
Section titled “Reading a failure”| Symptom in the log | Likely cause |
|---|---|
unresolved expression | Field reads a node that did not run, or a misspelled id |
| Step skipped entirely | Connected to a branch output that was not activated |
| Timeout on a tool step | Remote system slow or unreachable; check the timeout, then the target |
403 or scope error | Portal not resolved, or outside the actor’s scope |
| Run ends with no output | No Return / End reached on the taken path |
Limits and failure modes
Section titled “Limits and failure modes”- Testing with production data → a test can write. Use a synthetic ticket for anything that writes.
- Mocks believed to isolate everything → they isolate the mocked step only.
- Range set to “entire workflow” too early → you learn that something broke, not where.
- Testing a draft that is not active → runs work; the schedule and webhook do not.
- Ignoring the previous step → the failing step is often correct and the input is wrong.
Related topics
Section titled “Related topics”Workflow designer · Expressions and context · Common workflow failures · Examples