Quality
Quality answers a question metrics cannot: did the people who received this output find it useful? It aggregates the ratings users give MAIA Plus answers, sliced by who produced the output and who received it.
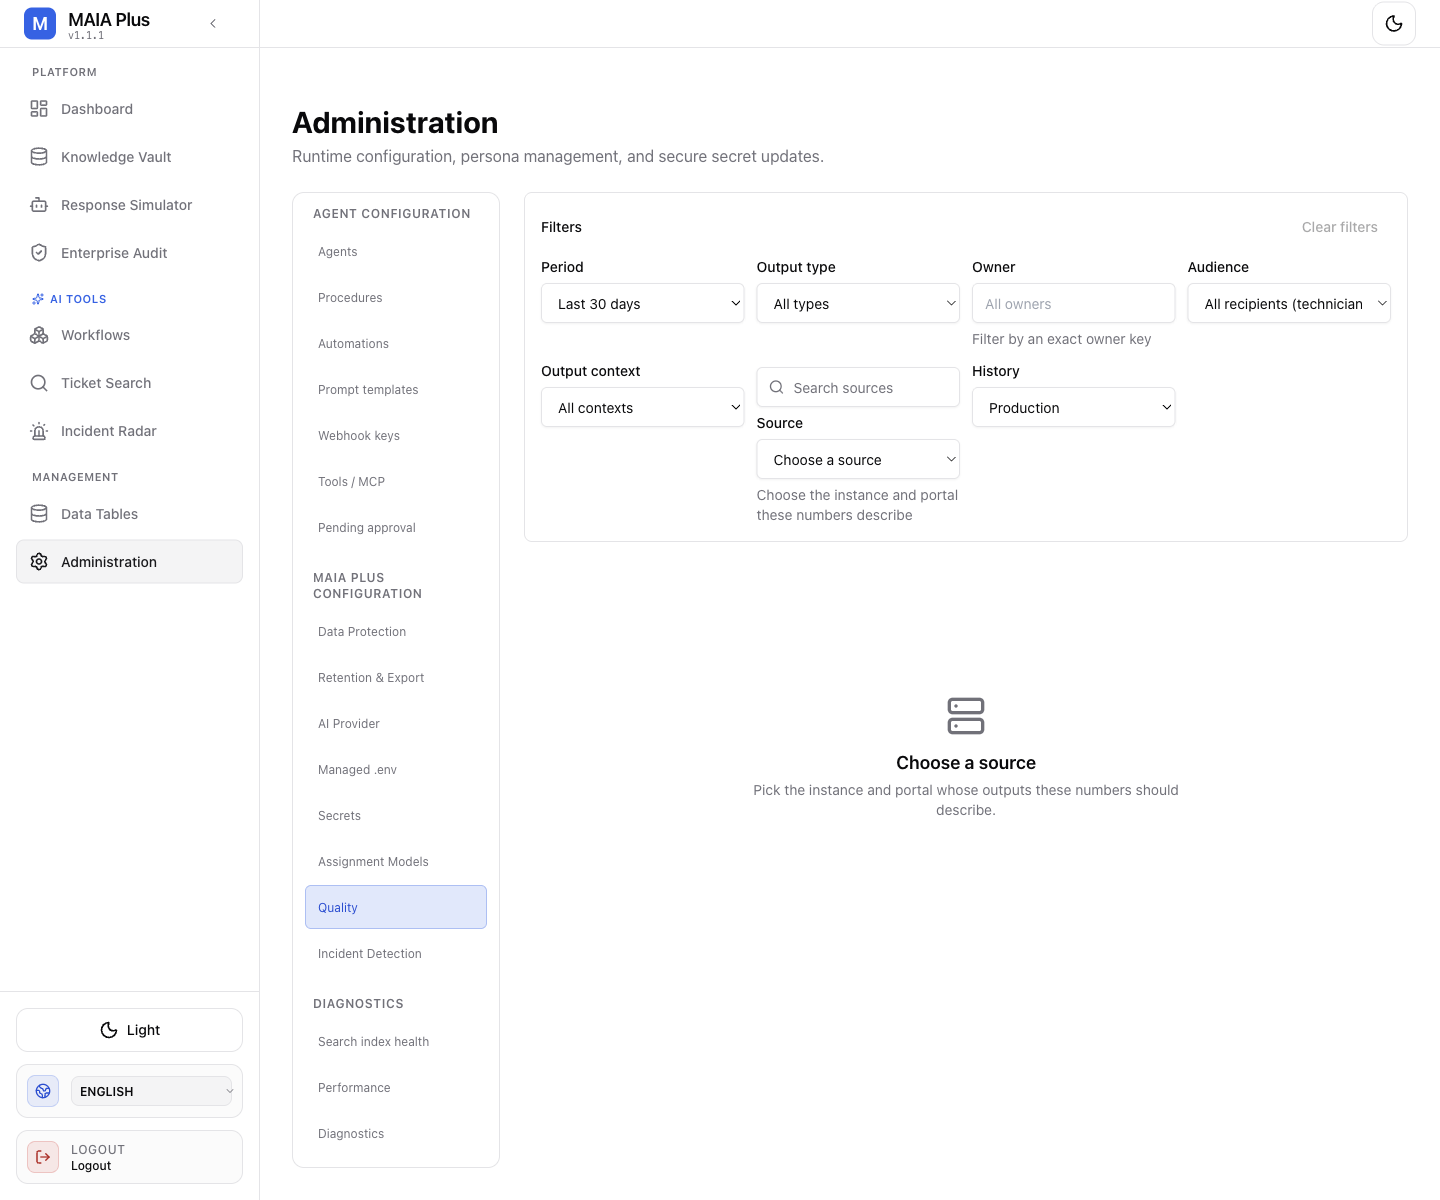
Filters decide the population; every number below them describes exactly that population.
What it is
Section titled “What it is”| Control | Values | What it changes |
|---|---|---|
| Period | Last 7 / 30 / 90 days, custom range | The window |
| Output type | All types, Agent, Automation, Workflow | Which producer |
| Owner | Exact owner key | One agent, automation or workflow |
| Audience | Technicians, Requesters, Administrators | Who received the output |
| Output context | Output kind | What the output was |
| Source | SDP instance and portal | Which installation the numbers describe |
| History | Production, Sample | Real feedback versus sampled/test traffic |
How it works
Section titled “How it works”- A user rates an answer — thumbs, survey or the rating control on the output.
- The rating is stored with the producer (owner kind and key), the audience, the source and the portal.
- The dashboard aggregates ratings into a rate and a count per slice.
- The trend chart shows movement over the selected period.
Two consequences the dashboard makes explicit:
- A rate without a count is meaningless.
75%from four ratings is noise. The UI shows both for that reason. - Audience matters more than the aggregate. An agent that technicians love and requesters distrust is worse than the average suggests.
Use it
Section titled “Use it”- Set the Source first. Numbers from another instance or portal describe another installation.
- Narrow to Production; sample traffic answers a different question.
- Pick the Output type and, when investigating, the exact Owner.
- Compare Audience: split technicians from requesters before drawing conclusions.
- Open the recent-feedback list and read the comments. A rating explains a score; a comment explains a cause.
Typical findings and what they mean:
| Pattern | Likely cause |
|---|---|
| Low requester ratings, healthy technician ratings | Persona and tone are wrong for requesters, or content too internal |
| Ratings fall after a provider change | Model or prompt behaviour changed — compare with AI providers |
| One workflow rated poorly | The workflow’s prompt or tool choice, not the agent |
| High rate, low count | Too few ratings to trust; check whether feedback is being collected at all |
What quality does not measure
Section titled “What quality does not measure”- Correctness. A confidently wrong answer can be rated useful by someone who did not know better.
- Cost or latency. Those live on the Dashboard and in Performance.
- Coverage. A high rate on ten rated answers says nothing about the 900 unrated ones.
Limits and failure modes
Section titled “Limits and failure modes”- Empty dashboard → no ratings in the period, or the wrong source selected.
- Sample namespace mixed in → test traffic inflates or deflates the rate.
- Owner renamed → history splits across two keys.
- Feedback not requested → the dashboard is silent rather than zero.
Related topics
Section titled “Related topics”Agents · Response Simulator · Enterprise Audit · Performance